Utilisation Rate
How is utilisation rate calculated?
Utilisation Rate
Utilisation Rate shows the percentage of available appointment book hours that have been used (excluding anything marked as non-worktime, eg. breaks).
Example
John Smith's appointment book is open from 9am - 5pm, Monday-Friday (40 hours).
He has a 1 hour lunch break each day (non-worktime), so therefore has 35 hours available in his appointment book.
If John has 30 hours of appointments scheduled, his utilisation rate is 86% (30 / 35). This is based on appointment duration, not check-in / check-out times.
Note: For this metric to be accurate, it is important that your appointment book templates are configured correctly with start / end times and holidays marked appropriately.
All breaks and non-appointment slots must be configured as non worktime. This can be confirmed by selecting Options -> Setup pre-booked slots.
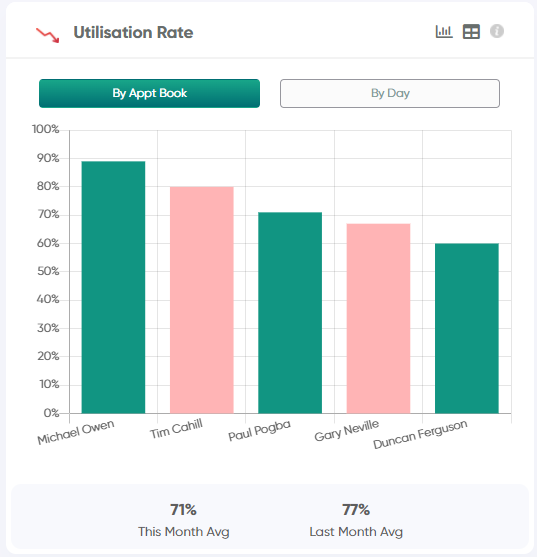
There are two options for this chart - "By Appt Book" and "By Day"
By Appt Book
Each bar on this bar chart represents a single appointment book. Hovering over each bar will display the appointment book name, utilisation rate, and breakdown of available hours vs used (appointment) hours.
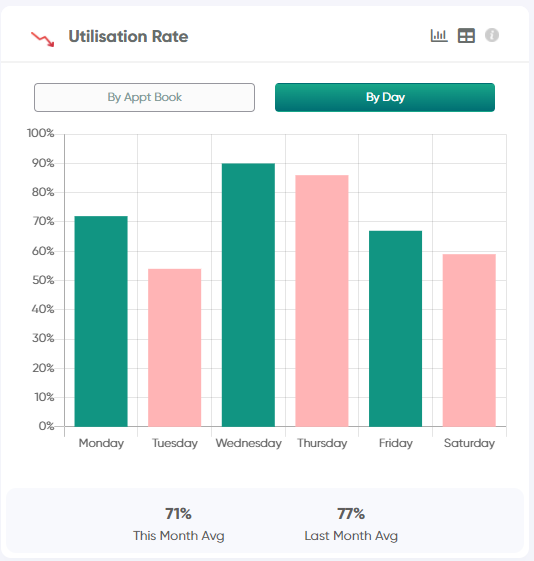
By Day
In "By Day" mode, each bar on this bar chart represents a single weekday in the period. Hovering over each bar will display the utilisation rate, and breakdown of available hours vs used (appointment) hours for that particular weekday.
Each bar on this bar chart represents a single appointment book. Hovering over each bar will display the appointment book name, utilisation rate, and breakdown of available hours vs used (appointment) hours.
By Day
In "By Day" mode, each bar on this bar chart represents a single weekday in the period. Hovering over each bar will display the utilisation rate, and breakdown of available hours vs used (appointment) hours for that particular weekday.
Clinic totals are shown in the text beneath these charts, with amounts shown for:
1) Total Utilisation Rate for the selected date range (eg. This Month)
2) Total Utilisation Rate for the previous date range (eg. Last Month)
3) The Utilisation Rate Goal for the period (optional - if configured in Settings)
Related Articles
Clinic Health - Chair Utilisation Rate
How is chair utilisation rate calculated on the health screen? Chair Utilisation Rate On the Jeeve Health Screen - Chair Utilisation Rate shows how busy your clinic is over the next 7 days (excludes today). This is calculated as the percentage of ...Hourly Rate
How is Hourly Rate calculated? Hourly Rate Hourly rate is calculated by taking the total amount of production and dividing it by the total number of appointment hours scheduled in that providers appointment book (ie. Appointment Duration) Note: Any ...Reappointment Rate
How is Reappointment Rate calculated? Reappointment Rate This metric is calculated by taking the total number of patients who had an appointment within the selected date range, then determining what percentage of them have a follow-up appointment ...Reappointment Rate (Clinic)
How is Reappointment Rate calculated? Reappointment Rate This metric is calculated by taking the total number of patients who had an appointment within the selected date range, then determining what percentage of them have a follow-up appointment ...Treatment Plan Completion Rate
How is Treatment Plan Completion Rate calculated? Treatment Plan Completion Rate The completion rate of treatment plans shows the percentage of items completed for plans created within the selected date range. It is measured per plan - then an ...